Customer Dialogue participants regularly review system data and identify trends. The most recent updates to this information are presented in the charts below.
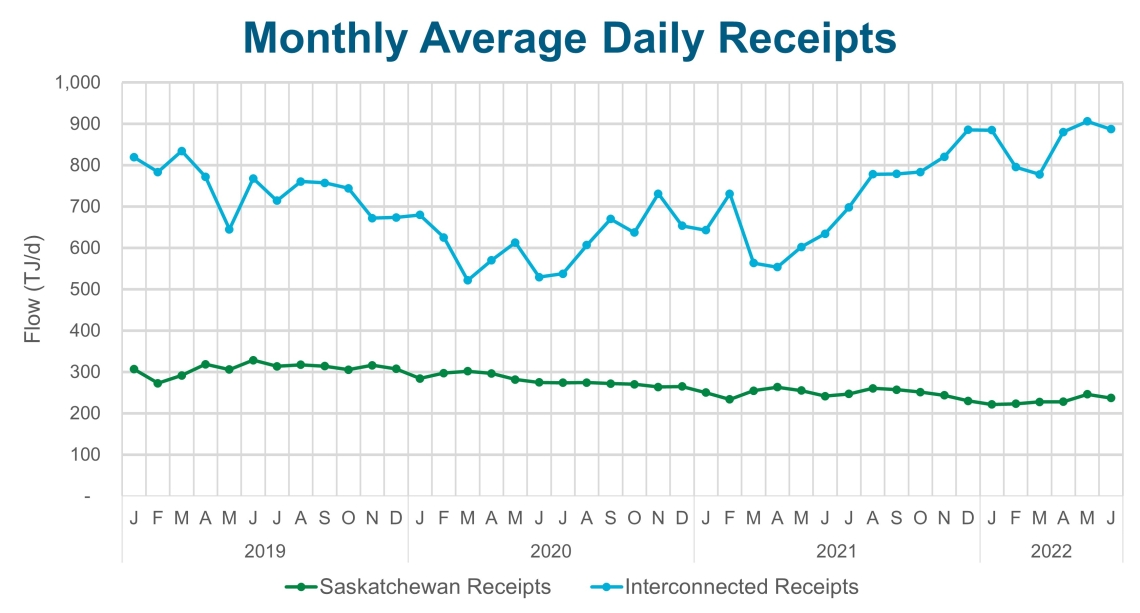
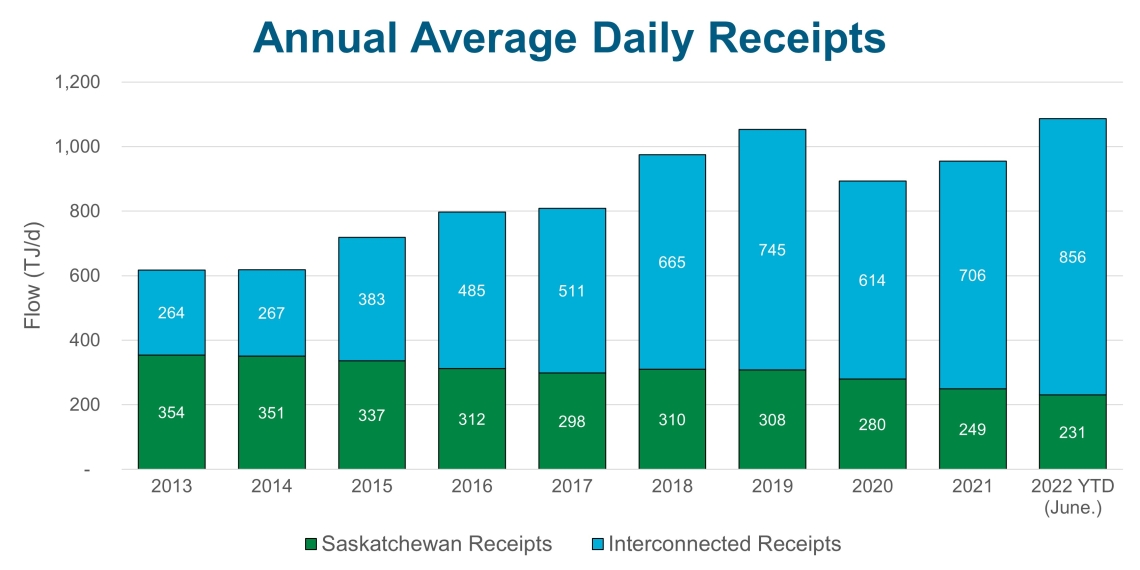
Receipt Volume
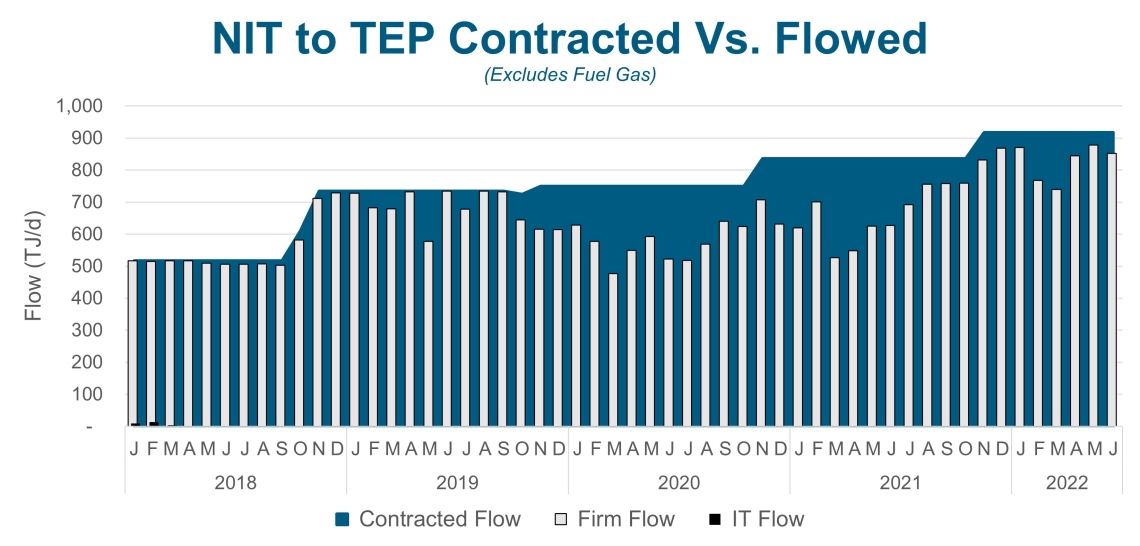
NIT to TEP Volume
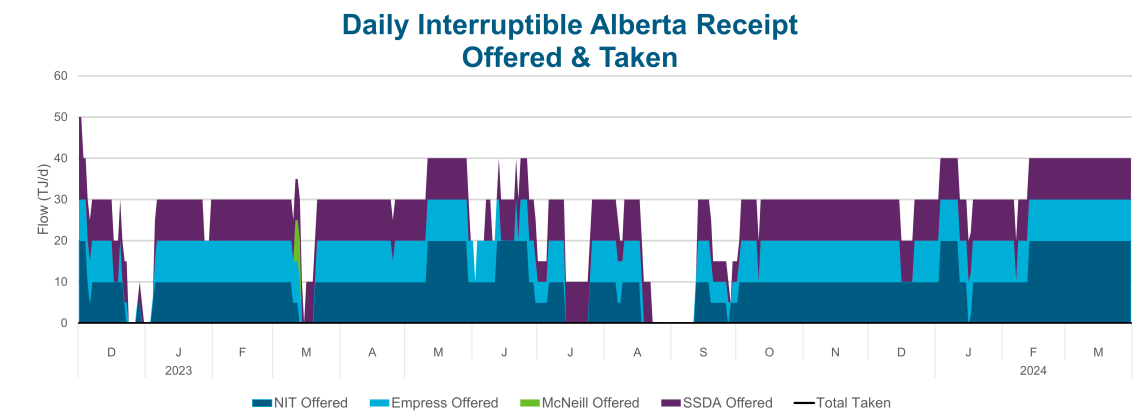
Interruptible Alberta Receipts
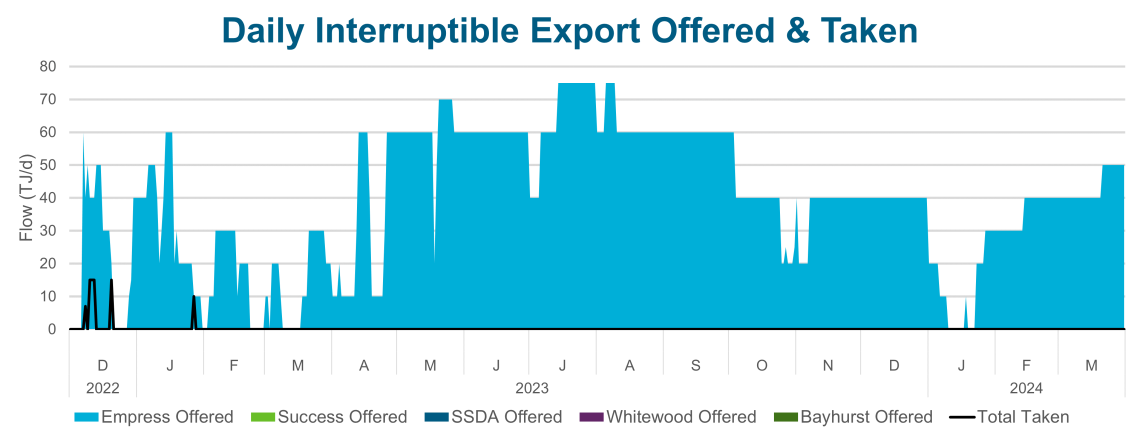
Interruptible Exports
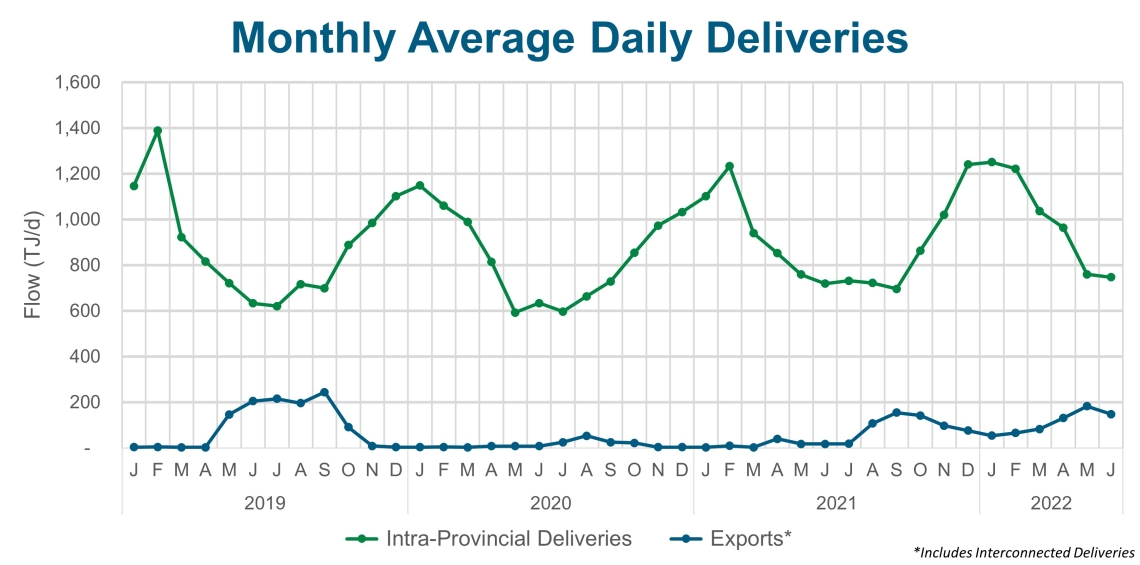
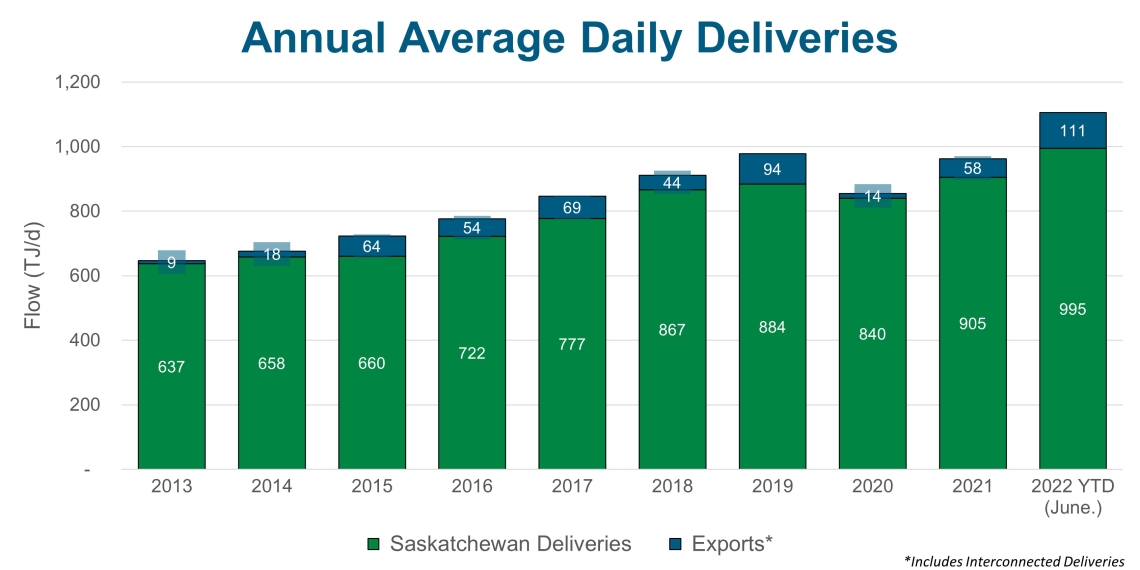
Delivery Volume
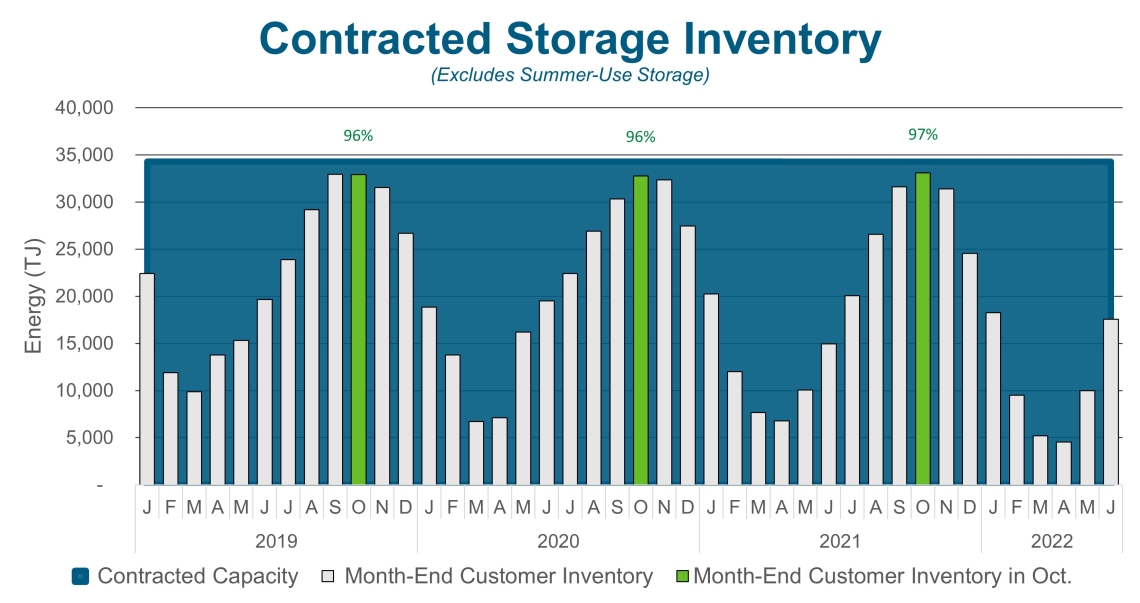
Storage Inventory